Project Data Visualization with Chart.js
Developed a visually intuitive and interactive solution to display key project metrics, empowering stakeholders with actionable insights for informed decision-making.
Key Achievements
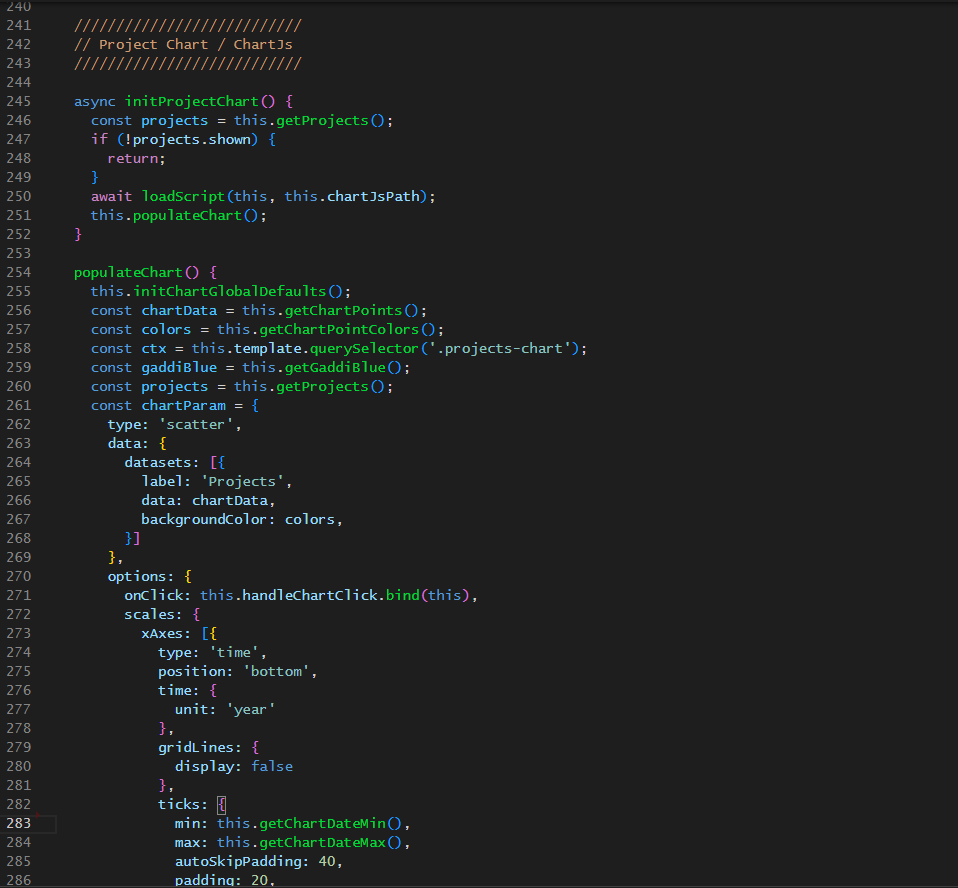
- Advanced data visualization: Implemented Chart.js to create a customizable scatter plot visualization, enabling users to easily grasp the distribution of project data and identify trends.
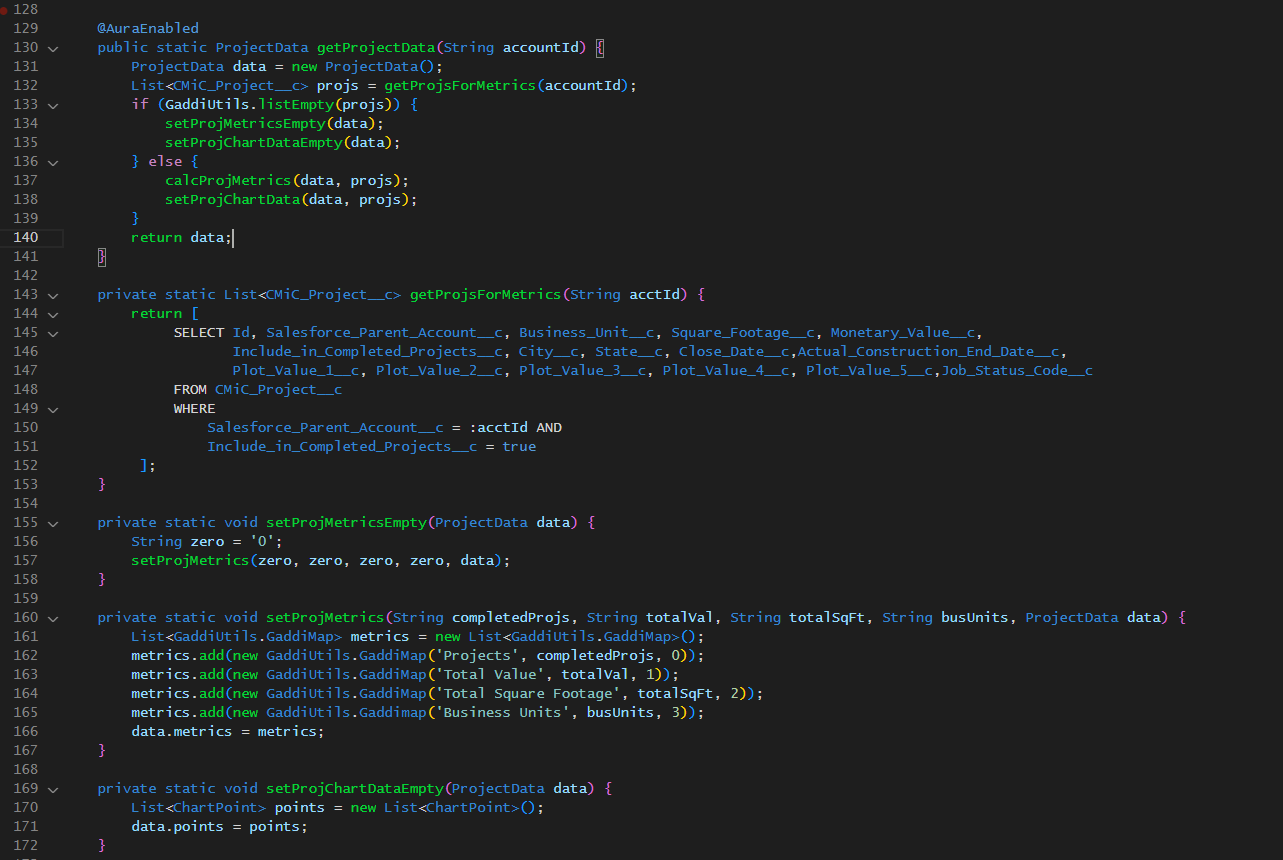
- Efficient data aggregation: Leveraged backend technologies to query and aggregate project data, calculating relevant metrics such as total dollar amounts and square footage.
- Dynamic chart scaling: Ensured optimal data presentation by automatically adjusting the X and Y axes of the scatter plot to accommodate varying data ranges.
- Interactive data exploration: Enabled users to hover over data points to reveal detailed project information, facilitating a deeper understanding of individual projects.
- Seamless integration: Embedded the visualization within a user-friendly web component, making it easily accessible within the client's existing platform.
Technologies
- JavaScript
- Chart.js
- Data Visualization
- Web Components
- Backend Integration
- Data Aggregation
Year
2022